
For my statistics class at WSU Tri-Cities, I had to do a research project on a set of data. Having heard repeated statements and questions along the lines of “since it was so snowy this winter, that means it will be unusually hot this summer, right?” When I learned I had to do this project, I immediately knew I had to see if I could find an answer to this question.
And the short answer? No. In fact, historically speaking winter snowfall doesn’t mean a whole lot for summer temperatures at all.
So how did I get to this answer? I took winter snowfall and compared it to three variables: the highest temperature reached the summer following, the number of days reaching above 90º, and precipitation for the months of June, July, and August. For the Tri-Cities, our weather data goes back to 1894. That said, snowfall records are missing from several years, most notably from the 1980s. Because of this, I was only able to get reasonable data from 87 years. Still, this was more than enough to be able to run the data through a statistics program on the computer.
I decided to use a method called bivariable correlation where I compared winter snowfall to the three variables mentioned above. This spits out a number, known as an r-value, that shows how strong a relationship is between the numbers that are being compared. The r-value will range from -1 to 1, but the presence of a negative only indicates the direction of the relationship. Both 1 and -1 indicate a perfect relationship, which for this study would mean that every year’s temperature or precipitation was directly related to the previous winter’s snowfall that would form a straight line on a graph. A value of zero means that there’s absolutely no relationship at all.
So if you were to make a graph (specifically a scatterplot), an r-value farther from 0 would indicate that the points from that dataset would be closer together and closer to the center line. This is probably easier shown than explained in text, so take a look at the graphs above for examples. The general interpretation is that if r is between -0.3 and 0.3 there is only a weak relationship if any, 0.3 to 0.5 (or the negative equivalent) would be a moderate correlation, and 0.5 to 1.0 (with its negative equivalent) would be a strong correlation.
Here are the r-values I got for the data I ran:
- Winter snowfall and hottest summer temperature, r=-0.27
- Winter snowfall and number of days above 90º, r=-0.22
- Winter snowfall and summer precipitation, r=-0.02
All of these are weak at best, and the correlation between snow and summer precipitation is almost nothing. So now that we have that, we need to look at the p-value. This is measured from 0 to 1 and if the number is below 0.05, we might actually have some sort of relationship. This is because when p=0.05, that means that you can be 95% confident that there is a relationship. Since 87 years is such a short time span when it comes to the climate of our region, that’s the confidence interval I want to use here. Here’s what I got for my p-values:
- Winter snowfall and hottest summer temperature, p=0.011
- Winter snowfall and number of days above 90º, p=0.040
- Winter snowfall and summer precipitation, p=0.845
Based on this, there might actually be something here worth looking at for temperature, but the number is far too high to say there’s anything going on with summer precipitation. There is something that concerns me about the temperatures, before we definitively say that there is actually some sort of relationship, though.
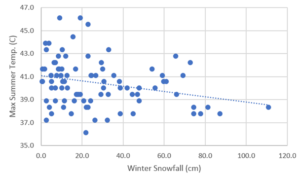
Here’s the scatterplot for winter snowfall and summer temperature (yes it’s in metric, that’s how I had to do it for class and I didn’t want to make another one). You’ll notice that one of the points is pretty far right when compared to the rest. This represents the winter of 1968-1969 and the following summer. That winter had so much snow it makes it an outlier for our test.
I felt like this one year was throwing everything off in a way that made it unreliable, so I decided to throw this year out because it was so extreme to see what. After I ran the program again, the result was interesting. The relationship for the temperature variables I tested weakened slightly, but the relationship for precipitation was actually made stronger. Here are the numbers I got:
- Winter snowfall and hottest summer temperature, r=-0.25, p=0.021
- Winter snowfall and number of days above 90º, r=-0.20, p=0.061
- Winter snowfall and summer precipitation, r=-0.09, p=0.399
Since the p-values for the number of days above 90º and summer precipitation are both above 0.05, it seems appropriate to say that within this dataset there isn’t a significant relationship between them and winter snowfall. For the hottest summer temperature, though, it seems appropriate to say there is a weak relationship between this and how much snow fell the previous winter.
Even with us saying there’s a weak relationship between the two, the idea that snowy winters lead to mega hot summers is a myth. Note that r is negative. That means that overall, snowy winters might actually lead into summers that don’t get quite as hot, and with r being so low, the “average” change is probably even less than a degree.
Since the relationship is so weak, there’s no way to make any sort of reliable prediction based on winter snowfall alone. There are so many other factors going on that can and often do impact our weather here in the Columbia Basin. While it’s possible that overall global patterns (like el niño) could persist from winter into summer, it is also possible that that pattern formed the year before, influenced that winter, and dissipated before the onset of summer.
Our atmosphere is a fluid and is heavily influenced by conditions in the ocean – another fluid. While it would be really handy to be able to point at the weather a few months ago and say “this means we’ll have this,” that is a broad oversimplification that simply doesn’t work.
The Climate Prediction Center is staffed by experts that know much more about this than I do. Their current forecast has us with between a 50% and 60% chance of above average temperatures for June, July, and August, with a 33% to 40% chance of above average precipitation. That’s the best that I can give you right now.
If you have questions or comments about this, want to the data I used, or noticed I got something wrong feel free to send me a message over on Facebook at Tri-Cities Weather or shoot me a tweet. On Twitter I’m @markaingalls. Thanks for reading!


